
Data science interview questions & Answers
Preparing for an interview to become a data scientist?
Data Science is one of the most well-known and widely used technologies in the world today. Professionals in this sector are being hired by major corporations. Data Scientists are among the highest-paid IT professionals due to strong demand and limited availability. The most commonly asked questions in Data Science job interviews are covered in this Data Science Interview questions and answers blog.
What is data science?
In basic terms, data science is an interdisciplinary branch of study that makes use of data for different research and reporting objectives in order to draw insights and meaning from it. Statistics, business acumen, computer science, and other abilities are all required in data science.
Learn how to become a data scientist from this link.
Who is a data scientist?
A data scientist is a person who is in charge of gathering, analysing, and interpreting massive volumes of data. Mathematicians, scientists, statisticians, and computer professionals are all examples of old technical jobs that have evolved into data scientists.
Advanced analytics technologies, such as machine learning and predictive modelling, are required for this position.
Click here to know the difference between data science vs machine learning
To create hypotheses, make conclusions, and evaluate consumer and market trends, a data scientist needs a lot of data. Gathering and analysing data, as well as employing various forms of analytics and reporting tools to discover patterns, trends, and correlations in data sets, are all basic tasks.
Data scientists in the business world usually work in groups to mine large data for information that can be used to anticipate consumer behaviour and uncover new income possibilities. In many businesses, data scientists are also in charge of establishing best practises for data collection, data analysis, and interpretation.
Data science skills have been more in demand as businesses seek to extract valuable information from big data, which refers to the massive volumes of structured, unstructured, and semi-structured data that a major organisation or the internet of things generates and gathers.
Learn data science online course from here and get certified as a data scientist.
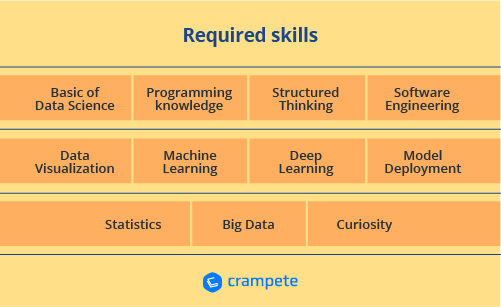
Required skills
- The fundamentals of Data Science
- Statistics
- Programming knowledge
- Data Manipulation and Analysis
- Data Visualization
- Machine Learning
- Deep Learning
- Big Data
- Software Engineering
- Model Deployment
- Communication Skills
- Storytelling Skills
- Structured Thinking
- Curiosity
Pros of Data science
- It’s in demand
- Abundance of positions
- A highly paid career
- Data Science is versatile
- Data Science makes data better
- Data Scientists are highly prestigious
- No more boring tasks
- Data Science can save lives
Cons of Data science
- Data Science is a blurry term
- Mastering data science is near to impossible
- Large amount of domain knowledge required
- Arbitrary data may yield unexpected results
- Problem of data privacy
Top 50 important data science interview questions and answers
Here are data scientist questions listed below for entry level and seniors to crack the interview in a easier way
Basic data science interview questions
1.What do you understand by linear regression?
The linear connection between the dependent and independent variables may be better understood using linear regression. Linear regression is a supervised learning method that aids in the determination of a linear connection between two variables.
The predictor, or independent variable, is one, and the response, or dependent variable, is the other. We aim to understand how the dependent variable evolves in relation to the independent variable in Linear Regression. Simple linear regression is used when there is only one independent variable, while multiple linear regression is used when there are several independent variables.
2. What is Data Science?
Data Science is a branch of computer science that focuses on transforming data into information and collecting useful information from it. The sort of insights Data Science allows us to draw from accessible data has led to some big advancements in a variety of goods and industries, wCommon interview questions for Data science: Tips for answers
hich is why it is so popular. We may use these insights to estimate a customer's taste, the chance of a product succeeding in a specific market, and so on.
3. What is dimensionality reduction?
The process of transforming a dataset with a large number of dimensions (fields) to a dataset with fewer dimensions is known as dimensionality reduction. This is accomplished by removing parts of the data set's fields or columns. This isn't done haphazardly, though. Only after ensuring that the remaining information is sufficient to concisely explain similar information are the dimensions or fields deleted in this procedure.
4. What is the bias in Data Science?
Bias is a sort of mistake that arises in a Data Science model when an algorithm is used that isn't powerful enough to capture the underlying patterns or trends in the data.
To put it another way, this mistake happens when the data is too complex for the algorithm to comprehend, causing it to construct a model based on basic assumptions. As a result of the underfitting, accuracy suffers. Linear regression, logistic regression, and other algorithms can cause a lot of biases.
5.Why R is used in Data Visualization?
With over 12,000 packages in open-source sources, r-for-your-data-science-project is the greatest ecosystem for data analysis and visualisation. It has a large community, which means you can quickly discover solutions to your difficulties on sites like StackOverflow.
It improves data management and facilitates distributed computing by dividing activities across several jobs and nodes, reducing the complexity and execution time of big datasets.
Learn why choose programming with r for your data science-project from here.
6. What is variance in Data Science?
Variance is a form of mistake that arises when a Data Science model becomes too sophisticated and learns characteristics from data while also taking into account noise. Even though the data and the underlying patterns and trends are relatively straightforward to detect, this type of mistake can arise if the method used to train the model is complicated.
As a result, the model is extremely sensitive, performing well on the training dataset but poorly on the testing dataset and on any type of data it hasn't seen before. Variance leads to poor testing accuracy and overfitting in most cases.
7.What is pruning in a decision tree algorithm?
Pruning a decision tree is eliminating portions of the tree that are no longer required or superfluous. Pruning results in a reduced decision tree with greater performance, accuracy, and speed.
8.What is information gain in a decision tree algorithm?
At each stage of the decision tree, we must design a node that determines which feature to utilise to divide data, i.e., which feature will best separate our data so that we can make predictions. Information gain, which is a measure of how much entropy is decreased when a specific characteristic is used to split the data, is used to make this selection. The characteristic that is used to divide the data is the one that provides the most information gain.
9.What is k-fold cross-validation?
We divide the dataset into k equal sections in k-fold cross-validation. Following that, we iterate through the full-dataset k times. One of the k parts is utilised for testing and the other k 1 part is used for training in each iteration of the loop. Each of the k portions of the dataset is utilised for training and testing purposes using k-fold cross-validation.
10.What is Deep Learning?
Deep Learning is a kind of machine-learning, in which neural networks are used to imitate the structure of the human brain, and just like how a brain learns from information, machines are also made to learn from the information that is provided to them. Deep Learning is an advanced version of neural networks to make machines learn from data.
In Deep Learning, the neural networks comprise many hidden layers (which is why it is called ‘deep’ learning) that are connected to each other, and the output of the previous layer is the input of the current layer.
Get to know about what machine learning is by clicking here.
Intermediate data science interview questions
1.How are Data Science and Machine Learning related to each other?
Data Science and Machine Learning are closely related topics that are sometimes misinterpreted. They both work with data. However, there are a few key characteristics that help us understand how they differ.
Data Science is a wide topic that works with enormous amounts of data and helps us to extract meaning from it. The complete Data Science process takes care of a number of processes that are involved in extracting insights from the given data. Data collection, data analysis, data modification, data visualisation, and other critical processes are all part of this process.
Data Science, on the other hand, may be regarded as a sub-field of Machine Learning. It likewise deals with data, but we're only interested in learning how to turn the processed data into a functional model that can be used to map inputs to outputs, such as a model that can take a picture as an input and tell us if it includes a flower as an output.
In a nutshell, Data Science is concerned with obtaining data, analysing it, and then deriving conclusions from it. Machine Learning is a branch of Data Science that deals with creating models using algorithms. As a result, Machine Learning is an essential component of Data Science.

2. Explain univariate, bivariate, and multivariate analyses.
When dealing with data analysis, words like univariate, bivariate, and multivariate are frequently used. Let's try to figure out what these terms imply.
Univariate analysis: Univariate analysis is the process of analysing data using only one variable, typically a single column or vector of data. This analysis enables us to comprehend the information and discover patterns and trends. Analyzing the weight of a group of people, for example.
Bivariate analysis: Bivariate analysis is analysing data using just two variables, or, in other words, putting the data into a two-column table. We can find out the link between the variables using this type of analysis. Analyzing data containing temperature and altitude, for example.
Multivariate analysis: The term "multivariate analysis" refers to the process of analysing data containing more than two variables. The data can have any number of columns other than two. We can find out the impacts of all other variables (input variables) on a single variable using this type of analysis (the output variable).
Analyzing data on property pricing, which includes information on the homes such as location, crime rate, area, number of floors, and so on.
3.What is the benefit of dimensionality reduction?
The dimensions and size of the entire dataset are reduced by dimensionality reduction. It removes superfluous elements while keeping the data's main information intact.
Data processing is faster when the dimensions are reduced. The fact that data with a lot of dimensions takes a long time to analyse and train a model on is one of the reasons why it's so tough to deal with. Reducing the number of dimensions speeds up the process, reduces noise, and improves model accuracy.
4. What is RMSE?
The root mean square error is abbreviated as RMSE. It's a metric for regression accuracy. The root mean square error (RMSE) is a method for calculating the extent of error caused by a regression model. The following is how RMSE is calculated:
First, we calculate the errors in the regression model's predictions. The discrepancies between the actual and projected values are calculated in this way. The mistakes are then squared. The mean of the squared errors is then calculated, and the square root of the mean of these squared mistakes is then calculated. This is the RMSE, and a model with a lower RMSE is thought to create fewer mistakes, implying that the model is more accurate.
5. What is a kernel function in SVM?
A kernel function is a specific mathematical function used in the SVM algorithm. A kernel function, in simple words, takes data as input and transforms it into the desired format.
This data transformation is based on something known as a kernel trick, which is also the name of the kernel function. We can transform data that is not linearly separable (cannot be split using a straight line) into data that is linearly separable using the kernel function.
6.What is ensemble learning?
Our objective when utilising Data Science and Machine Learning to create models is to develop a model that can comprehend the underlying trends in the training data and make accurate predictions or classifications.
However, some datasets are extremely complex, and it might be challenging for a single model to comprehend the underlying trends in these datasets. In some cases, we merge many separate models to increase performance. This is referred to as ensemble learning.
7.Explain boosting in Data Science.
One of the ensembles' learning approaches is boosting. Unlike bagging, it is not a strategy for training our models in parallel. In boosting, we construct several models and train them sequentially by merging weak models iteratively in such a manner that the training of a new model is dependent on the training of previous models. When training the new model, we use the patterns learnt by the prior model and test them on a dataset.
We assign greater weight to observations in the dataset that are poorly handled or forecasted by prior models in each iteration. Boosting can also be used to reduce model bias.
8.Explain stacking in Data Science.
Stacking, like bagging and boosting, is an ensemble learning technique. We could only combine weak models that utilised the same learning techniques, such as logistic regression, in bagging and boosting. Homogeneous learners are the names given to these models. Stacking, on the other hand, allows us to combine weak models that employ various learning methods.
Heterogeneous learners are those who learn in a variety of ways. Stacking works by training several (and distinct) weak models or learners, then combining them by training a meta-model to generate predictions based on the numerous outputs of these multiple weak models.
9.Explain how different Machine Learning is from Deep Learning.
Machine Learning is a branch of Data Science that deals with leveraging current data to assist systems in learning new abilities to do different jobs without the need for explicit rules to be coded.
Deep Learning, on the other hand, is a branch of Machine Learning that deals with creating Machine Learning models using algorithms that attempt to mimic how the human brain learns from data in order to gain new abilities. We use a lot of deeply connected neural networks with a lot of layers in Deep Learning.
10.Why does Naive Bayes have the word ‘naive’ in it?
The Naive Bayes algorithm is a Data Science technique. Because it is based on the Bayes theorem, which deals with the likelihood of an event occurring given that another event has already occurred, it includes the term "Bayes" in it.
It's called naïve because it assumes that each variable in the dataset is unrelated to the others. For real-world data, this type of assumption is impractical. Even with this assumption, it is quite beneficial for addressing a variety of difficult issues, such as spam email categorization.
Advanced data science interview questions
1.Mention the different kernel functions that can be used in SVM.
In SVM, there are four types of kernel functions:
- Linear kernel
- Polynomial kernel
- Radial basis kernel
- Sigmoid kernel
2.How to detect if the time series data is stationary?
When the variance or mean of a time series data set remains constant throughout time, it is referred to as stationary data. If the variance or mean of a dataset does not vary over time, we may conclude that the data is stable for that time period.
3.What does root cause analysis mean?
The technique of determining the underlying causes of certain defects or failures is known as root cause analysis. A factor is called a root cause if, once it is removed, a series of actions that previously resulted in a fault, error, or unpleasant consequence now function correctly.
Root cause analysis is a technique that was first created and used for the investigation of industrial accidents, but it is now utilised in a wide range of situations.
4.What is A/B testing?
For randomised trials with two variables, A/B testing is a type of statistical hypothesis testing. These variables are denoted by the letters A and B. When we want to test a new feature in a product, we utilise A/B testing. We provide users with two variations of the product in the A/B test, and we call these variants A and B.
The A variation may be the product with the new feature, whereas the B variant could be the one without it. We collect customer ratings for these two items after they have used them. If product variation A receives a statistically significant higher rating, the new feature is deemed an improvement and helpful, and it is adopted. If this is not the case, the new feature will be withdrawn from the product.
5.What is reinforcement learning?
Reinforcement learning is a subset of Machine Learning that focuses on creating software agents that do behaviours in order to maximise the number of cumulative rewards. Here, a reward is utilised to inform the model (during training) if a certain activity leads to the achievement of or takes it closer to the objective.
For example, if we create a ML model that plays a video game, the reward will be either the points gathered or the level attained in the game. Reinforcement learning is used to create these types of agents that can make real-world decisions that will help the model achieve a clearly stated goal.
6.Explain TF/IDF vectorization.
The acronym Term Frequency–Inverse Document Frequency (TF/IDF) stands for Term Frequency–Inverse Document Frequency. It is a numerical metric that allows us to assess how significant a word is to a document within a corpus of texts. Text mining and information retrieval frequently employ TF/IDF.
7.What are the assumptions required for linear regression?
There are several assumptions required for linear regression. They are as follows:
- The data, which is a sample drawn from a population, used to train the model should be representative of the population.
- The relationship between independent variables and the mean of dependent variables is linear.
- The variance of the residual is going to be the same for any value of an independent variable. It is also represented as X.
- Each observation is independent of all other observations.
- For any value of an independent variable, the independent variable is normally distributed.
8. What happens when some of the assumptions required for linear regression are violated?
These assumptions may be mildly broken (i.e., minor violations) or severely violated (i.e., significant violations) (i.e., the majority of the data has violations). In a linear regression model, both of these violations will have distinct impacts.
Violations of these assumptions render the results completely useless. The results will have more bias or variance if these assumptions are violated lightly.
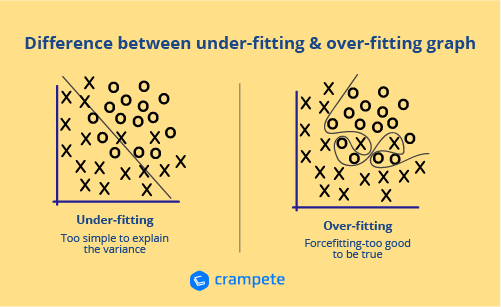
9. What are the differences between overfitting and under-fitting?
When a statistical model is overfitted, it describes random error or noise rather than the underlying relationship. When a model is overly complicated, such as when there are too many parameters in relation to the amount of data, overfitting occurs. Overfitted models have poor prediction performance because they overreact to slight changes in the training data.
When a statistical model or machine learning method fails to reflect the data's underlying trend, this is known as underfitting. When fitting a linear model to non-linear data, for example, underfitting might occur. A model like this would also do poorly in terms of prediction.
10.What is Survivorship Bias?
It is the logical mistake of concentrating on factors that aid in the survival of a process while carelessly dismissing others that failed due to their lack of prominence. This can lead to erroneous conclusions in a variety of ways.
Data science interview questions and answers for freshers/Juniors
1. Difference between Regression and Classification?
The primary distinction between regression and classification is that regression produces a continuous quantitative value, whereas classification predicts discrete labels.
However, there is no obvious distinction between the two. Both Regression and Classification share a few characteristics. The following are the details:
Regression
- The quantity is predicted via regression.
- For regression, we may use both discrete and continuous data as input.
- Time series forecasting is created when input data is organised according to time.
Classification
- Binary Classification refers to the challenge of classifying two classes.
- Multi-class classification and multi-label classification are two types of classification.
- In Classification, we place a greater emphasis on accuracy, but in Regression, we place a greater emphasis on the error term.
2. What is Natural Language Processing? State some real-life examples of NLP.
Natural Language Processing (NLP) is a field of artificial-intelligence that deals with translating human language into machine-understandable language so that ML models can process it.
Examples — Natural language processing has a wide range of applications, including chatbots, Google Translate, and a variety of real-time applications such as Alexa.
Know the difference between data science vs artificial intelligence and eliminate your doubts.
3.What is the significance of sampling? Name some techniques for sampling?
For huge datasets, we can't go through the entire volume at once to analyse the data. We'll need to gather some data samples that can reflect the entire population. We should select data that is a genuine representation of the entire data set when creating a sample from complete data.
There are primarily two types of statistical sampling procedures.
- Non-Probability Sampling and Probability Sampling are two types of sampling.
- Simple Random, Clustered Sampling, and Stratified Sampling are all types of probability sampling.
Convenience sampling, quota sampling, and snowball sampling are examples of non-probability sampling.
4.What are the conditions for Overfitting and Underfitting?
When the model is overfitted, it works well with the training data but fails to provide results with new data. Underfitting is caused by a model that is too basic to detect the proper relationship. The bias and variance criteria are listed below.
Overfitting - An overfitted model has a low bias and a high variance. Overfitting is more likely in decision trees.
Underfitting is characterised by a high bias and a low variance. This model likewise fails to perform well on test data. Linear Regression, for example, is more prone to Underfitting.
5. What is Imbalanced Data? How do you manage to balance the data?
If a set of data is dispersed across several categories and the distribution is severely skewed. Imbalance Data is a term used to describe this type of information. These types of datasets generate model performance errors by making categories with big values significant for the model, resulting in a model that is incorrect.
Handling data on imbalances may be done in a variety of ways. For minority classes, we can increase the quantity of samples. For classes with a large number of data points, we can reduce the number of samples. To expand the amount of data points for all of the categories, we may utilise a cluster-based method.
6. Explain the Unsupervised Clustering approach?
Clustering is a technique for grouping data into various clusters depending on the distribution of data.
1. Density Based Clustering
2. Hierarchical Clustering
3. Partition Based Clustering
4. Distribution Based Clustering
7. What is deep learning?
Deep Learning is a subfield of machine learning and artificial intelligence that aims for greater accuracy and the ability to create complicated models. Deep Learning models have a structure that is similar to that of human brains, with the input layer, hidden layer, activation function, and output layer all meant to mimic the structure of a human brain.
8.What are the steps in making a decision tree?
- Take the entire data set as input.
- Look for a split that maximizes the separation of the classes. A split is any test that divides the data into two sets.
- Apply the split to the input data (divide step).
- Re-apply steps one and two to the divided data.
- Stop when you meet any stopping criteria.
- This step is called pruning. Clean up the tree if you went too far doing splits.
9. Explain cross-validation.
Cross-validation is a model validation approach for determining how well the results of a statistical investigation will generalise to another set of data. It's mainly used in situations when the goal is to forecast and the user wants to know how accurate a model will be in practise.
The aim of cross-validation is to create a data set to test the model in the training phase (i.e. validation data set) in order to avoid issues like overfitting and provide insight into how the model will generalise to a different data set.
10. What are the drawbacks of the linear model?
- The linearity of the mistake assumption
- It can't be utilised for binary or count results.
- There are certain overfitting issues that it is unable to resolve.
Data science interview questions and answers for experienced
1. Why do we need deep learning over machine learning?
When data becomes greater, machine learning fails to enhance accuracy. With additional data, the algorithms get saturated, and the weights do not alter as predicted. As a result, Deep Learning is favoured for larger datasets where the Neural Network is used to give a superior accuracy slope. It's also useful for non-structured data like photos and words.
2. Lay out the differences between a histogram and a bar graph?
For discrete data, a bar graph is utilised, whereas for continuous data, a histogram is used. In a bar graph, there is a gap between the bars, but in a histogram, there is none. Because the histogram is a continuous scale, this is the case. In a bar graph, the order of the bars may also be modified and rearranged according to the needs of the scenario. In the histogram, however, this is not an option.
3. Explain how you will handle missing values in our data?
If your record has very little genuine data and most of it is missing, the first thing you can do is exclude it from your analysis entirely. We must eliminate it since its quality is so bad that it will have a detrimental impact on the analysis. So, rather than creating a record with very little data, it's preferable to leave it out.
However, if you are collecting client data, they may lose out on certain information, either due to a human error or because they do not respond. You can contact them again, ask them questions, and try to obtain information if that is possible.
Otherwise, you may merely make reasonable assumptions to represent the values and fill in the blanks. This can be accomplished by using averages or regression or by devising your own method for imputing the missing number.
4. What is the “POWER” of a hypothesis test?
The power of a hypothesis test is the chance of avoiding making type 2 mistakes. When running a hypothesis test, we want to avoid making any errors, or at very least reduce the chances of making type 1 or type 2 errors. A hypothesis test's power is proportional to the type 2 errors.
5.When is the resampling done?
Resampling is a data sampling technique that improves accuracy and quantifies the uncertainty of population characteristics. It is done to check that the model is adequate by training it on various patterns in a dataset to guarantee that variances are handled. It's also done when models need to be verified using random subsets or when running tests with labels substituted on data points.
6. How are the time series of problems different from other regression problems?
- Time series data may be thought of as an extension of linear regression, which uses concepts such as autocorrelation and average movement to summarise previous data of y-axis variables in order to forecast a better future.
- The fundamental objective of time series of issues is forecasting and prediction, when precise forecasts may be produced, but the underlying causes are not always known.
- The presence of time in an issue does not imply that it is a time series problem. For an issue to become a time series problem, there must be a relationship between the target and time.
- The observations that are near in time are anticipated to be comparable to those that are far away, providing seasonality and accountability. Today's weather, for example, would be comparable to tomorrow's weather but not to weather four months from now. As a result, forecasting the weather based on historical data becomes a time series challenge.
7.How do you approach solving any data analytics based project?
- The first stage is to fully comprehend the company need or problem.
- Then, thoroughly examine and evaluate the facts you've been given. If any data is missing, contact the company to clarify the needs.
- The following stage is to clean and prepare the data, which will then be utilised for modelling. The variables are converted and the missing values are available here.
- To get useful insights, run your model on the data, create meaningful visualisations, and evaluate the findings.
- Release the model implementation and evaluate its usefulness by tracking the outcomes and performance over a set period of time.
- Validate the model using cross-validation.
8.What is the difference between the Test set and the validation set?
- The test set is used to evaluate or test the trained model's performance. It assesses the model's prediction ability.
- The validation set is a subset of the training set that is used to choose parameters in order to avoid overfitting the model.
9.How is feature selection performed using the regularization method?
Regularization is the process of adding penalties to various parameters in a machine learning model in order to reduce the model's flexibility and minimise overfitting.
Regularization methods such as linear model regularisation, Lasso/L1 regularisation, and others are available. The linear model regularisation multiplies the predictors by a penalty applied to the coefficients. The Lasso/L1 regularisation has the property of reducing certain coefficients to zero, allowing it to be eliminated from the model.
10. What do you understand by a kernel trick?
Kernel functions are extended dot product functions that are utilised in high-dimensional feature space to compute the dot product of vectors xx and yy. Kernal trick technique is used to solve a nonlinear issue by converting linearly inseparable data into separable data in higher dimensions using a linear classifier
Data science course syllabus is a broad discipline that includes topics such as data mining, data-analyst, data visualisation, machine learning, deep learning, and, most significantly, mathematical principles such as linear algebra and statistical analysis. Because being a skilled professional Data Scientist requires a lot of prerequisites, the advantages and benefits are substantial.
Click to know the data science course syllabus from here.
These days, data scientist is the most sought-after job title. In this article, we have seen the most common-interview-questions on Data Science for both freshers and experienced.
Data science problem solving questions
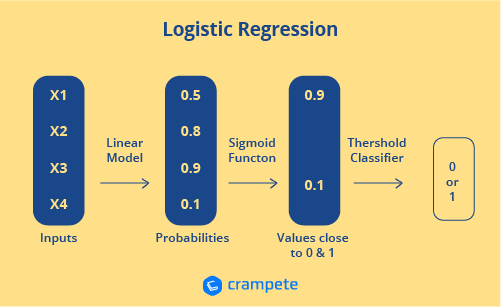
How is logistic regression done?
By estimating probability using its underlying logistic function, logistic regression assesses the connection between the dependent variable (our label for what we want to predict) and one or more independent variables (our features) (sigmoid).
The following diagram shows how logistic regression works:
2.How can you avoid overfitting your model?
Overfitting is a term used to describe a model that is only trained on a tiny quantity of data and misses the larger picture. To avoid overfitting, there are three major methods:
- Keep the model basic by using fewer variables, which will help to eliminate some of the noise in the training data.
- Cross-validation methods like k folds cross-validation should be used.
- Use regularisation techniques like LASSO to punish specific model parameters that are prone to overfitting.
3. You are given a data set consisting of variables with more than 30-percent missing values. How will you deal with them?
The following are some options for dealing with missing data values:
We may simply delete the rows with missing data values if the data set is big. It is the fastest method; we forecast the values based on the rest of the data.
We may use the pandas data frame in Python to replace missing values with the mean or average of the remainder of the data for smaller data sets. There are several methods for doing so, including df.mean() and df.fillna() (mean).
Learn python-interview-questions-answers from here.
4. How can outlier values be treated?
Outliers may only be removed if the value is trash.
Adult height = abc ft, for example. This isn't possible since the height can't be a string value. Outliers can be deleted in this situation.
The outliers can be eliminated if their values are severe. For example, if all of the data points are grouped between zero and ten, but one is at one hundred, we may exclude that point.
If you can't get rid of outliers, try the following:
- Attempt a new model. Nonlinear models can fit data that linear methods have identified as outliers. As a result, be certain you select the proper model.
- Attempt to normalise the data. The extreme data points are brought into a comparable range in this way.
- Random forests are an example of an algorithm that is less impacted by outliers.
5.How can you calculate accuracy using a confusion matrix?
The whole data, actual values, and anticipated values may all be shown.
The formula for accuracy is:
Accuracy = (True Positive + True Negative) / Total Observations
=(260+346)/650
=0.93
As a consequence, we achieve a 93 percent accuracy.
6. How did you help solve the problem your recent project presented?
You'll probably get some inquiries about the solution you picked for your situation. These might include inquiries such as:
What was the solution to the problem?
What model did you choose and why?
How did you arrive at this solution?
Was this solution given to you to execute?
Were you the one who identified and/or designed the solution?
What is the impact the solution will have on the company?
To begin writing your response, consider how you contributed to the project's success. Provide concrete instances that demonstrate your grasp of your role within the larger context of the team you were on, as well as your ability to solve problems creatively and successfully cooperate.
Maybe you had an idea that led the team in an entirely new path, or maybe you were able to provide a unique viewpoint on a certain approach because you had previously used it and could warn teammates about some of the unforeseen disadvantages. Drill deeper to find out what you contributed to the solution, as well as how it affects your customer or organisation.
7. How do you organize big sets of data?
As a data scientist, you'll frequently have to combine enormous quantities of data from multiple platforms and organise them in a way that allows for further analysis. This is a crucial question since it assesses your understanding and ability to organise vast amounts of material.
Your response should demonstrate that you are familiar with both the procedures and the tools necessary for data organisation. Consider talking about a time when you organised a significant amount of data, describing the tools you utilised and the outcomes of your efforts.
8.Explain how a ROC curve works?
The ROC curve is a graphical depiction of the difference in true positive and false-positive rates at certain thresholds. It's frequently used as a proxy for the sensitivity (true positive rate) vs. false-positive rate trade-off.
9.How Regularly Must an algorithm be updated?
As data flows through infrastructure, you want the model to change.
- The source of the underlying data is shifting.
- There is a non-stationarity case.
- The algorithm operates poorly, and the findings are inaccurate.
10.Name a few Machine Learning libraries for various purposes?
| Purpose | Libraries |
| Scientific Computation | Numpy |
| Tabular Data | Pandas |
| Data Modelling & Preprocessing | Scikit Learn |
| Time-Series Analysis | Statsmodels |
| xt processing | Regular Expressions, NLTK |
Data science course syllabus is a broad discipline that includes topics such as data mining, data-analyst, data visualisation, machine learning, deep learning, and, most significantly, mathematical principles such as linear algebra and statistical analysis. Because being a skilled professional Data Scientist requires a lot of prerequisites, the advantages and benefits are substantial.
These days, data scientist is the most sought-after job title. In this article, we have seen the most common-interview-questions on Data Science for both freshers and experienced.
FAQs
1. How do I prepare for a data science interview?
Aside from SQL, most data scientist jobs require a rudimentary understanding of at least one programming language, the most prevalent of which are Python and R. Some interviewers, unlike most SQL interviews, will ask you to execute your Python/R code.
2. What is data science Short answer?
Data science is a subset of artificial intelligence that encompasses the overlapping fields of statistics, scientific techniques, and data analysis, all of which are used to extract meaning and insights from data. Deep learning, a subtype of machine learning, allows computers to solve more difficult tasks.
3. What is a data scientist salary?
In India, the average data scientist salary is Rs. 698,412. An entry-level data scientist may earn around Rs. 500,000 per year with less than a year of experience.
4. Do data scientists have coding interviews?
The ability to create code is the most important and ubiquitous talent for data scientists (and the one that distinguishes them from data analysts). Data scientists can utilise code to create models or algorithms that will assist them get even more insight into the data as they analyse it.
5. What kind of questions are asked in data science interview?
Job interviews in data science may be nerve-wracking. During technical interviews, you will frequently be asked to develop an experiment or a model. You might need to use Python and SQL to address difficulties. You'll almost certainly be asked to demonstrate how your data abilities relate to company choices and strategy.
6. How many rounds are in a data science interview?
This consist of 4 to 5 rounds of interview with a combination of technical and behavioural inquiries, as well as whiteboarding. The duration ranges from 2 to 8 hours. Because you'll be meeting with so many individuals, it might be a full day of interviews or a series of one-hour interviews with various people spread out over many days.

Accelerate Your Career with Crampete
Sign up to our newsletter!

Related Blogs

Students who wish to learn how to make data-driven decisions and examine strategies to optimise an organization's profit using data can enrol in a Data Science course in India. Data science is a popular career path because it has applications in high-demand industries such as banking, energy, pharmaceuticals, and healthcare.

How to Become a Data Scientist in 2024? Could I become a Data Scientist? What are the skills that are required to become a Data Scientist?

It’s known that the data around us is piling up at a rapid pace. And there’s always, therefore, a need for studying and analysing the raw data generated from various sources. A data professional is someone who studies chunks of data and analyses them to decipher information.
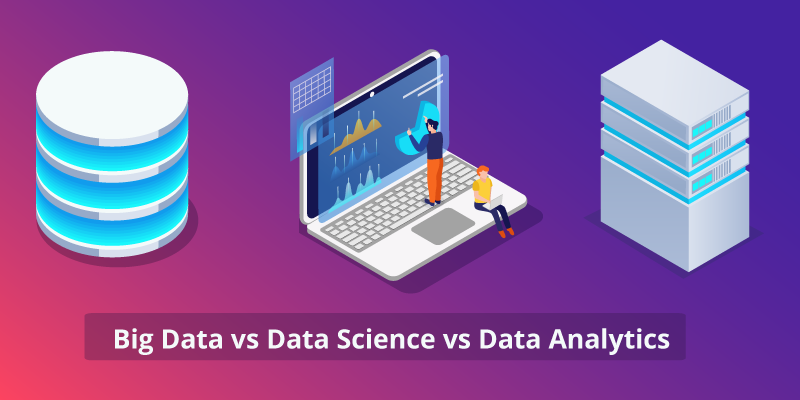
Big data vs data science Vs data analytics! Which is better for you? Big data vs. data science vs. data...